Introduction
DomainGraph is a Java plugin for Cytoscape, a software platform for the analysis and visualization of molecular interaction networks. AltAnalyze stores input files for AltAnalyze in "AltResults/DomainGraph" for direct import into DomainGraph.
The main functionality of the DomainGraph plugin is the visual analysis of the effects of alternative splicing on genes, protein isoforms, molecular interactions, pathways and miRNA binding sites. Statistical results of Exon Array data computed with AltAnalyze can be imported into DomainGraph and affected genes, pathways and miRNA binding sites are automatically annotated. From these annotations, genes, gene products, and pathways can directly be loaded and visualized via DomainGraph and occurrences of alternative splicing are highlighted. Therefore, an in-depth analysis of Exon Array data regarding alternative splicing events and their biological impact is easily possible without the need of prior knowledge.
Furthermore, the detailed analysis of interaction networks and pathways is possible. Given a gene interaction network, DomainGraph visualizes the genes together with all known encoded protein isoforms and their respective domain compositions. Given a protein interaction network, DomainGraph decomposes the proteins into their domains and visualizes the domain interactions underlying the protein interactions. These networks can be integrated with exon expression data produced by the Affymetrix Exon Array. Genes, protein isoforms and domains are highlighted according to potentially occurring alternative splicing events or differential expression in different groups of samples.
Details
Once alternative probesets have been identified from an AltAnalyze exon array analysis, you can easily load this data in the Cytoscape plugin DomainGraph to:
- Visualize interaction networks between proteins and specific protein domains.
- Assess which probesets overlap with a set of loaded genes and which specific protein domains at a high-level (protein/domain network) and low-level (domain/exon/probeset view).
- Immediately see which probesets overlap with known/predicted alternative splicing events, alternative promoter selection or microRNA binding sites.
Installing DomainGraph and Instructions The most up-to-date DomainGraph installers, documentation and tutorials can be found here.
Figure 1
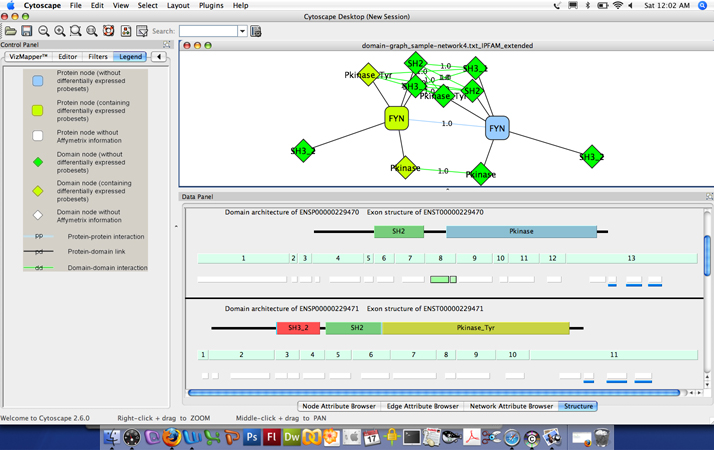
Visualization of AltAnalyze regulated probests along exons and protein domains: In the top panel, a loaded Cytoscape DomainGraph network is shown for the gene FYN, with relevant protein domain interactions shown between two alternative isoforms of each gene. Rounded boxes represent gene nodes and diamonds, protein domains and other functional elements. Greenish yellow nodes represent those containing AltAnalyze regulated probesets, whereas green do not overlap with an AltAnalyze regulated probeset. The gene FYN has been selected in the main network which creates a domain architecture and exon structure view for the select FYN isoform in the Cytoscape "Data Panel". Domains (top), exons (middle) and probesets (bottom) are shown that correspond to the FYN isoforms ENSP00000229470 and ENSP00000229471, with AltAnalyze down-regulated probesets in green. Probesets with a solid black border are associated with alternative splicing (alternative cassette exon) in this example, overlapping with exon 8 and the Protein Kinase domain of the protein. Probesets with a blue bar beneath them overlap with predicted microRNA binding sites. Details about each domain, exon, probeset and microRNA binding site, including AltAnalyze statistics and functional annotations are accessible by mousing-over the respective feature and by left-clicking the object to link-out to resources on the web.
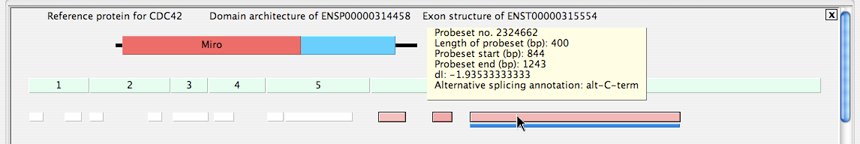
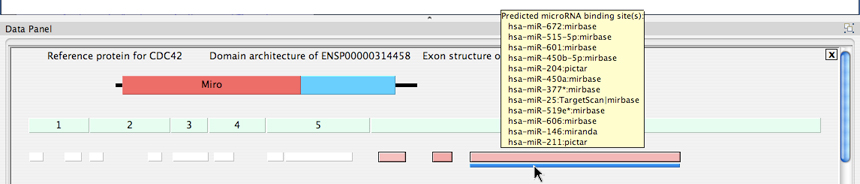
Figure 2
Accessing Splicing and MicroRNA Binding Site Annotations: Two panels are shown for the DomainGraph view of one isoform of the protein CDC42, with AltAnalyze regulated probesets aligning to an alternative C-terminal exon. The top panel displays the probeset ID (Probeset no.), probeset position and length parameters, the splicing-index fold change or aka change in exon-inclusion (dI) score and the alternative exon annotation from AltAnalyze (Alternative splicing annotation), when the highlighted probeset (pink box) is moused-over. Likewise, when the blue line below it is moused-over, the users sees all of the predicted microRNA binding sites that exist within the sequence space of the probeset.