Alternative Exon Visualization in AltAnalyze
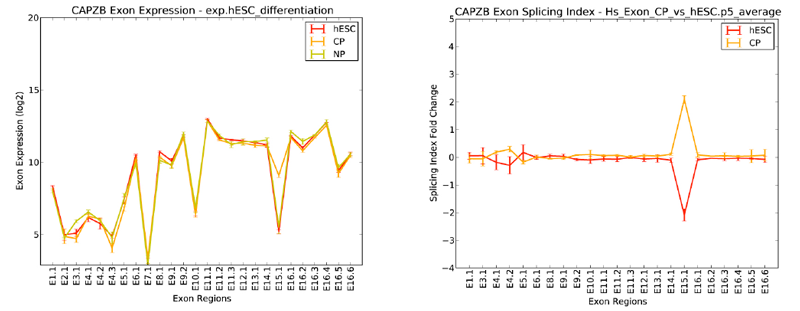
In addition to visualization of alternative exons in the Cytoscape plugin DomainGraph, AltAnalyze contains a built in alternative exon viewer called AltExonViewer. This function allows users to display gene data in the form of a line graph depicting exons along the X-axis and exon-expression or splicing index fold change along the Y-axis.
Analysis Details
Expression values from each group are summarized as a single line color, with standard-error values included. One gene or multiple genes can be displayed at a time using a manual text entry field (e.g., SOX2 NANOG POU5F1 TCF7L1) or through a file selection option. Probed UTR regions and Introns can also be optionally displayed.
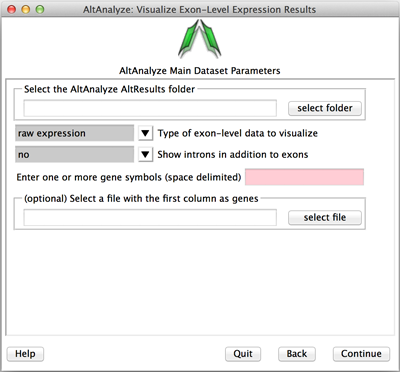
To visualize exon-expression, select the raw expression option. This option requires that input expression files have already been generated and analyzed with AltAnalyze (conforming to the standard file locations – e.g., ExpressionInput/exp. file). To visualize alternative exon-expression directly, select the splicing-index option. This option works for already produced alternative exon results, which are saved to the folder AltResults/RawSpliceData. When analyzing a dataset with more than two groups, re-run the AltAnalyze workflow beginning with the Process AltAnalyze Filtered option and selecting the all groups selection for Comparisons to Perform option.