Tutorial 1 - Analyzing Conventional Microarrays
One of the most basic functions in AltAnalyze is to summarize data from a typical gene expression microarray experiment. Unlike more advanced features (e.g., analysis of splicing with exon or exon-junction data), this option allows you to easily get statistics and annotations for your dataset without having had to had prior experience with analyzing microarray data. The below steps will walk you through performing a basic gene expression analysis with AltAnalyze using sample data.
Downloading AltAnalyze
AltAnalyze can be downloaded for multiple operating systems from http://www.altanalyze.org. Once you have downloaded the compressed archives to your computer, extract these to an accessible folder on hard-drive (e.g., your user account).
Downloading Sample Data
Starting with CEL files
AltAnalyze can directly process Affymetrix CEL files. Click here to download sample data and obtain expression values.
Starting with expression values (OPTIONAL)
Download sample expression values for a mouse gene expression dataset, from here. This dataset is an embryonic stem cell differentiation time-course. Add the following prefix to the downloaded expression file, “exp.”.
Making Group and Comps files outside of AltAnalyze (OPTIONAL)
If your dataset has over 30 CEL files or dozens of groups, it may save you time to make the groups and comps files in advance. Although not recommended when working with this dataset, go here if this applies to your own dataset.
Running AltAnalyze
Now you are ready to process your raw input files and obtain gene expression statistics and annotations. To proceed:
- Open the AltAnalyze program folder and open the file “AltAnalyze". In Windows, this file has the extension “.exe”. If you are working on a Linux machine or are having problems starting AltAnalyze, you can also start the program directly from the source code.
- AltAnalyze: Introduction: In the resulting introduction window, select “Begin Analysis”.
- AltAnalyze: Download Databases: When starting AltAnalyze for the first time you will be prompted to download databases. In this initial prompt, select "Continue", unless you are working on a computer without an internet connection. In the next window, select the species (e.g., "Mus Musculus") from the species select drop down menu (leaving the default Ensembl version) and then "Continue".
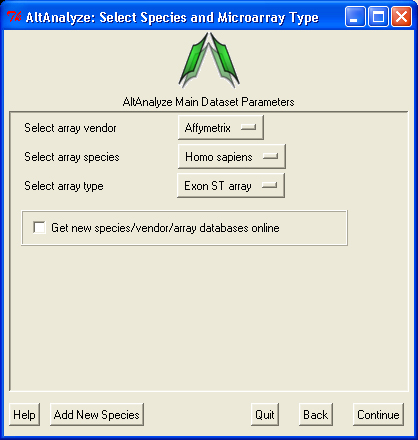
- AltAnalyze: Select Species and Array Type: Select the platform type (e.g., Affymetrix), species (e.g., “Mus Musculus”), the array type ("Affymetrix expression array") and “Continue”.
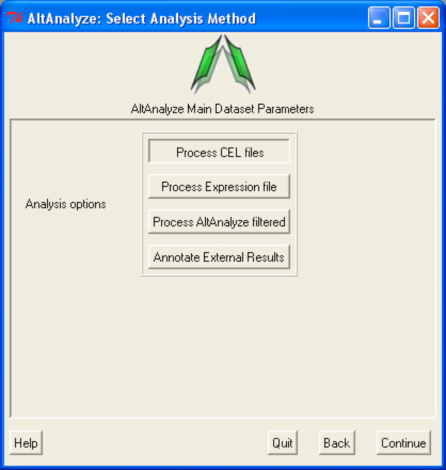
- AltAnalyze: Select Analysis Method: Select the “Process CEL files” button and "Continue".
- AltAnalyze: Select CEL files for APT: For dataset name, type in "mESC_differentiation" (or your experiment name), select the directory containing the CEL files (make sure these have been extracted from the TAR file and Gzip files) and then select an empty directory to save the results to.
- AltAnalyze: Select CEL files for APT: In the resulting warning window, select download for AltAnalyze to automatically download and install the library and annotation files for that array. If it can not, you will need to provide these from the Affymetrix website when prompted.
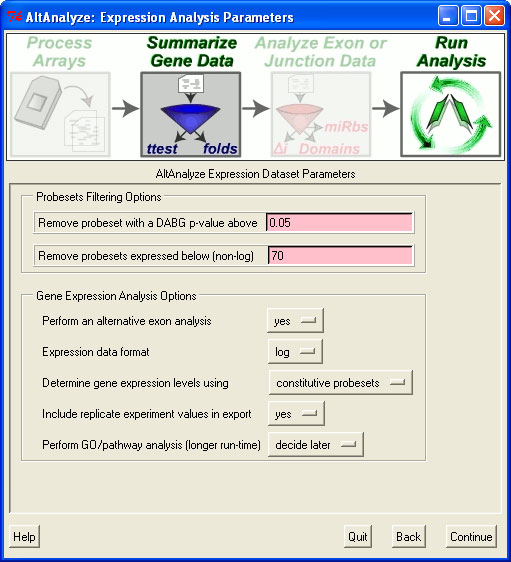
- AltAnalyze: Expression Analysis Parameters: Accept the default parameters by clicking “Continue”. These options can be modified later on, if you wish to increase or decrease the stringency of the analysis. Note: The last option on the page, "Perform GO/pathway analysis" can be selected but will increase the run-time significantly (see GO-Elite below).
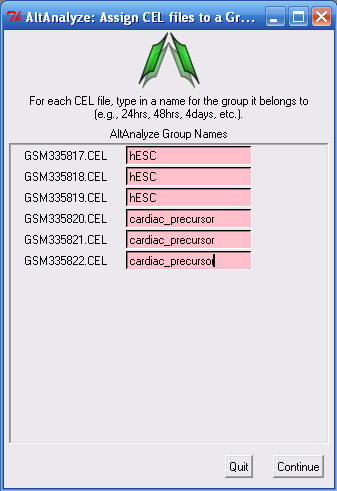
- AltAnalyze: Assign CEL files to a Group: Type in the group name for each sample (use intuitive names based on the filename).
- AltAnalyze: Establish All Pairwise Comparisons: Selects the groups to compare.
- A new window will appear that displays the progress of the analysis. NOTE: On Mac OS X, no progress is displayed for CEL file summarization since this is handled by the program APT. Analysis of the sample dataset should take approximately 5 minutes, but can take longer depending upon the number of samples to analyze, array type, machine and operating system. When finished, AltAnalyze will display a new pop-up window, informing the user that the analysis is complete.
Interpreting the Results
AltAnalyze will produce a set of files from your expression study that will be saved to the folder “ExpressionOutput” in the user-defined results directory. Among the files in this directory, the file with the name "DATASET-mESC_differentiation.txt" is a tab-delimited text file that can be opened in a spreadsheet program like Microsoft Excel, OpenOffice or Google Documents. It reports gene expression values for each sample and group in your probeset input expression file. Along with the raw gene expression values, statistics for each indicated comparison (mean expression, folds, non-adjusted and adjusted f-test p-values) will be included along with gene annotations for that array, including Ensembl and EntrezGene associations, Gene Ontology, pathway, predicted miRNA binding sites and other annotations.
Pathway Analysis and Clustering in GenMAPP-CS
Once finished, you can directly load your gene expression results for analysis in several programs. The main file to analyze has the name "GenMAPP" in the folder "ExpressionOutput". To quickly determine if there are biological pathways (WikiPathways) or Gene Ontology (GO) categories that contain a disproportionate number of regulated genes, you can utilize the GO-Elite algorithm, available from:
- within AltAnalyze (see above)
- from the GO-Elite web query interface or stand-alone program.
- from GenMAPP-CS
To allow immediate visualization of WikiPathway results, use GenMAPP-CS. To do this, see the following set of tutorials. In addition, you can perform expression clustering in GenMAPP-CS by following these instructions.