Venn Identifier Comparison Analyses
To evaluate similarities and difference between different gene sets or other IDs obtained from AltAnalyze or outside programs, two tools are available within AltAnalyze for merging files and/or visualizing ID overlaps.
Selecting Files for Venn Diagram Visualization
From the AltAnalyze main menu, select your species and platform. Instead of indicating the platform you can also select "Other ID" as the data type and the gene system you are analyzing as the "platform ID". Select Continue and then Additional Analyses. From here, select Venn Diagram to see the options for loading your input ID lists to compare.
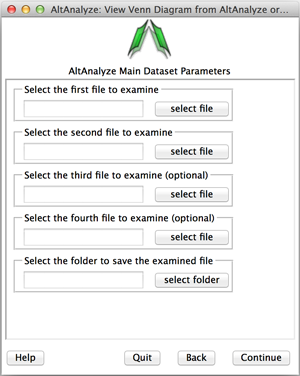
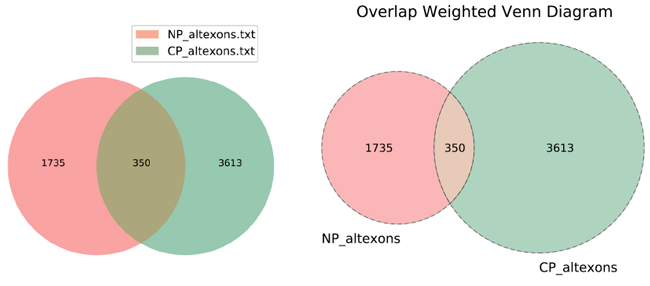
For this analysis, species and platform selection are not important. Select the different files of interest, containing comparable IDs in the first column of those files. Select an output directory for which you want the two types of Venn Diagrams to be saved to. Two methods are available for visualization of these diagrams: (A) Standard overlapping Venn’s and (B) ID membership weighted. The standard overlapping Venn will have equally sized circles or ovals representing IDs from each individual files.
Method Details
The repository for the standard Venn diagram open-source code is no longer maintained, while the ID membership weighted Venn was obtained from the open-source project matplotlib-venn. This output will weight the circles in the Venn based on the relative overlap of IDs in each file (max of 3 files). Both of these outputs are automatically produced and saved to the indicated output directory with a time-stamp in the filename.