Sample Classification and Model Evaluation in LineageProfiler
In addition to predicting the cell or tissue-type of a given sample, LineageProfiler can be used to classify samples as belonging to a particular disease or treatment category. This is done by supplying an optional custom reference file and one or more gene models to test (see below sections). More advanced gene model discovery options can also be performed when running the command-line version of this code (see below).
Prior to performing sample classification, the user must generate at least two files and an optional 3rd file:
- Expression file
- Reference file
- Model file (optional)
Once created, the user is ready to run LineageProfiler from either the AltAnalyze graphical user interface or the command-line LineageProfilerIterate script. The results will be a tab-delimited text file that assigns a prediction score for samples the input models and reference classes.
AltAnalyze Graphical User Interface
To perform, download AltAnalyze from http://www.altanalyze.org, extract to your hard drive and install the latest human database when prompted (currently EnsMart65) after running the first time. From the Main Menu select “vendor/data type” as “Other ID” and under “platform” select “Symbol”, then select “Continue”. Next, select “Additional Analyses” then select “Continue”. Next, select the menu item “Lineage Analysis” and “Continue”.
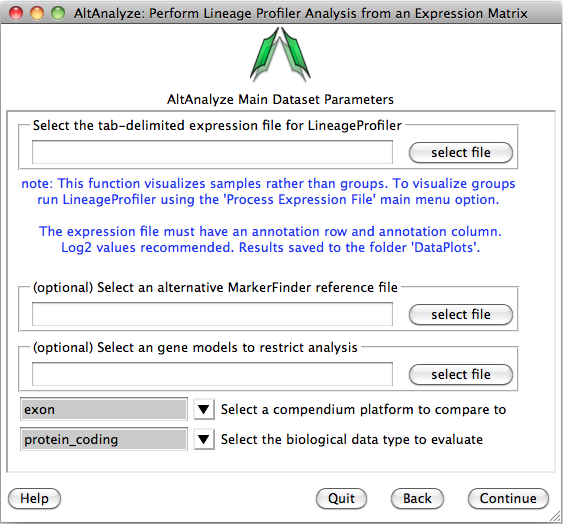
You will be presented with the analysis window to upload you expression (e.g., delta CT) values for your analyzed set of IDs (e.g., genes) and a reference expression file containing your two classes (e.g., cancer and wt) (“Select an alternative MarkerFinder reference file”). Next, you can optionally select the option “Select marker models to restrict analysis to”, to select a file with different ID sets to analyze. Leave the other options as default and select continue to run.
Command-Line LineageProfilerIterate Script
When the command-line version of this code is run, the user has access to additional options, principally, identifying new optimal performing gene models given a user supplied reference file and expression file. Unlike novel discovery analyses, no model file is supplied and the expression file sample headers must indicate the class of the sample (e.g., cancer:sample1, wt:sample2). The reference file must contain the same class names (e.g., cancer and wt). An example reference and expression file can be downloaded here.
The script can be downloaded from here and requires installation of Python and the python library Scipy. Details on installing both are covered here. To run the script, save the LineageProfilerIterate.py file in a convenient location, open a command-prompt (Windows) or terminal window (Mac), change directories to the LineageProfilerIterate.py location and copy the full directory paths of your reference and expression files. Expression files are indicated by --i and reference files by --r.
Different gene model sizes can be selected with the option --s. For datasets with 20 or evaluated markers, the option --s optimize is recommended. The optimize function begins by testing all possible genes (n=50), selects the best model and then evaluates all possible n-1 combinations of that model (49 genes). This analysis is iterated for all n>3 gene combinations. This is in opposition to an exhaustive approach (all possible combinations for all n>3 gene models), which is computationally prohibitive.
Examples:
Discover all possible 7-gene models from the sample data
python LineageProfilerIterate.py --i "/Users/me/patients.txt"
  --r "/Users/me/references.txt" --s 4
Classify known samples with existing gene models
python LineageProfilerIterate.py --i "/Users/me/patients.txt"
  --r "/Users/me/references.txt" --m "/Users/me/7GeneModels.txt"
Expression File
The expression file consists of normalized expression values (e.g., microarray, qPCR delta CT values) in a tab-delimited text file format with the file extension .txt. The first column in this file contains IDs that match first column of the reference file, the first row contains sample names and the remaining data consists of normalized expression values (e.g., delta CT values).
Reference File
The reference file can be generated from in an automated manner or manually. It consists of three columns, the first column contains IDs (e.g., gene ID or symbol) that match the first column of the expression file and two additional columns contain expression values for the two classes of interest (e.g., cancer and wt). The reference file can be built using multiple methods, including:
- Automatically generated from AltAnalyze (MarkerFinder results file).
- Directly obtained from an experiment (e.g., pooled reference sample RNA).
- Created from a collection of assayed samples using aggregated data (e.g., median or mean for each gene).
Model File
The model file consists of rows of IDs that are subsets of the IDs found in the reference and expression files. If this file is not provided, all IDs present will be used for classification. However, the model file allows for different ID sets to be evaluated as potential prognostic markers, with the combined results from these models presented in the output file (see example here). The best performing models discovered in a training set can be obtained from the Command-Line LineageProfilerIterate tool.
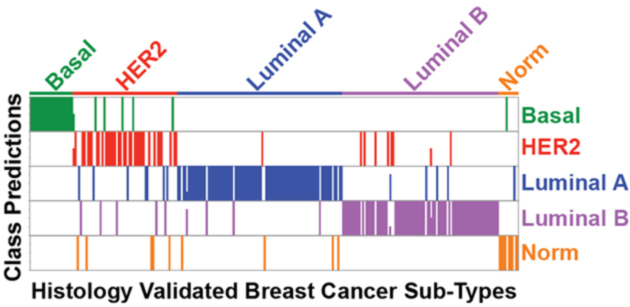
Output
When evaluating multiple distinct sample classes (e.g., tumor types), a combined model score will be reported along with the number of models that indicate a particular disease class. Below is a graphical output of the number of models that indicate sample class for an independent test set from the PAM50 qPCR dataset.