Tutorial 3 - Analyzing RNASeq Alternative Exons & Junctions
The below tutorial applies to the analysis of RNA sequencing data. A separate tutorial for the analysis of Affymetrix Exon and Gene arrays can be found here. If using an Affymetrix junction array, the analysis steps below and results are analogous (load your arrays and select the proper platform where indicated).
Introduction
AltAnalyze allows users to assess differential gene expression, sample quality, alternative exon expression, isoform functional relevance and enriched gene-sets. For RNA-Seq data, AltAnalyze takes pre-aligned exon-junctions and/or exon coordinates and read counts for gene and alternative isoform-level analyses (junction and/or exon). AltAnalyze makes this process relatively easy, with the user only required to download and extract the program and provide one set of basic files. In the following tutorial we will walk through these steps using a sample dataset.
Downloading Sample Data
Sample data can be downloaded here.
Building Junction and Exon Alignments
AltAnalyze can be run with junction and/or exon read counts from BED format (e.g. TopHat) or BioScope result files. Instructions for obtaining junction and exon-level input files from your sequencing experiments can be found here. If you already have junction.bed files, instructions for building exon.bed files can be found here. These instructions will have you:
- Load your junction files in AltAnalyze
- Build an exon coordinate reference for BEDTools
- Build an exon count BED file for each BAM file
Installing AltAnalyze and Saving Your Data
AltAnalyze version 2.0 can be downloaded for multiple operating systems from http://www.altanalyze.org. Once you have downloaded the compressed archive to your computer, extract it to an accessible folder on your hard-drive using your built-in unzip or commercial packages. In addition to AltAnalyze, Cytoscape and DomainGraph are automatically downloaded when a species database is first installed (see below for details).
Creating a Comparison and Groups File (OPTIONAL)
If your dataset has over 30 BED files or dozens of groups, it may save you time to make the groups and comps files in advance. Although not recommended when working with this sample dataset, go here if this applies to your own dataset.
Running AltAnalyze
Now you are ready to process your input files and obtain alternative exons with alternative splicing and functional annotations. If running through the graphical user interface follow the below directions, otherwise follow the commandline options for RNASeq analysis. To proceed:
-
Open the AltAnalyze_v2release program folder and select the binary file “AltAnalyze”. In Windows, this file has the extension “.exe”. If you are having problems starting AltAnalyze, you can also start the program directly from the source code.
-
AltAnalyze: Introduction: In the resulting introduction window, select “Begin Analysis”.
-
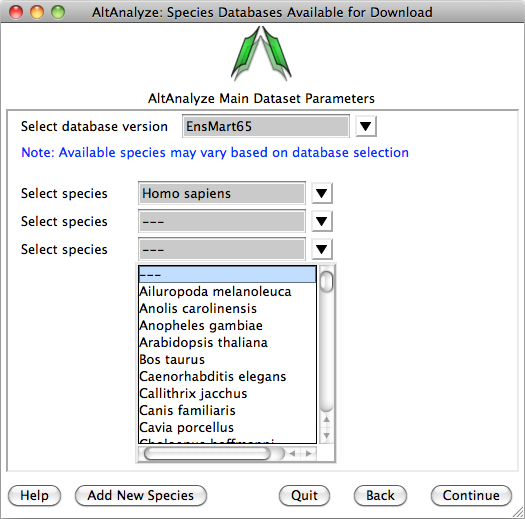
AltAnalyze: Download Databases: When starting AltAnalyze for the first time you will be prompted to download databases. In this initial prompt, select "Continue", unless you are working on a computer without an internet connection. If the latter applies, click here. Otherwise, select the species "Homo sapiens" from the species select drop down menu (leaving the default Ensembl version) and then "Continue".
-
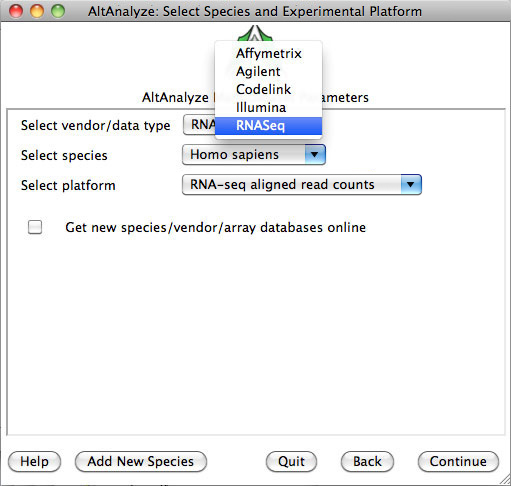
AltAnalyze: Select Species and Platform Type: Select the species “Homo sapiens”, the platform "RNASeq" and “Continue”.
-
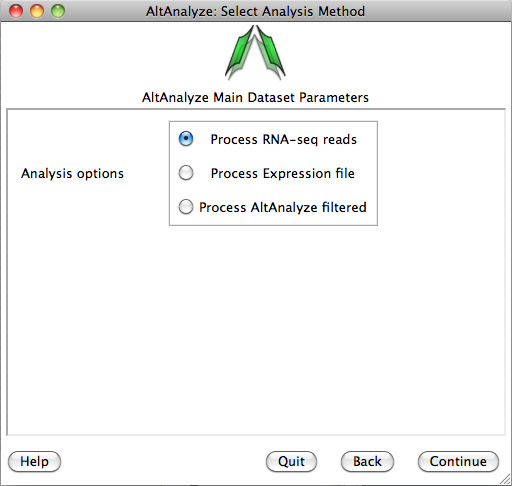
AltAnalyze: Select Analysis Method: Select the “Process Junction files” button and "Continue".
-
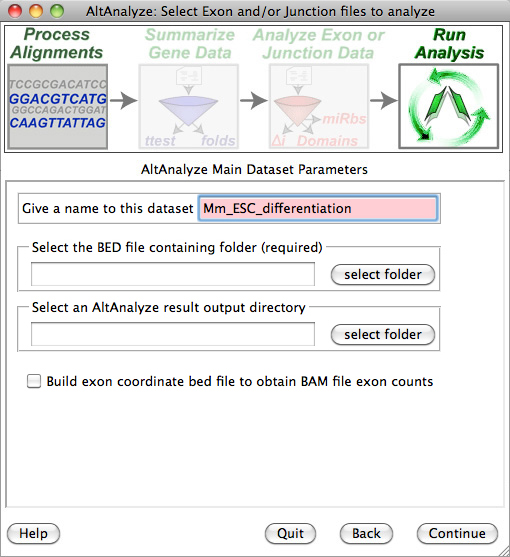
AltAnalyze: Select BED files for Import: For dataset name, type in "hESC_differentiation", select the directory containing the BED files (make sure these have been extracted from the TAR file and Gzip files) and then select an empty directory to save the results to.
-
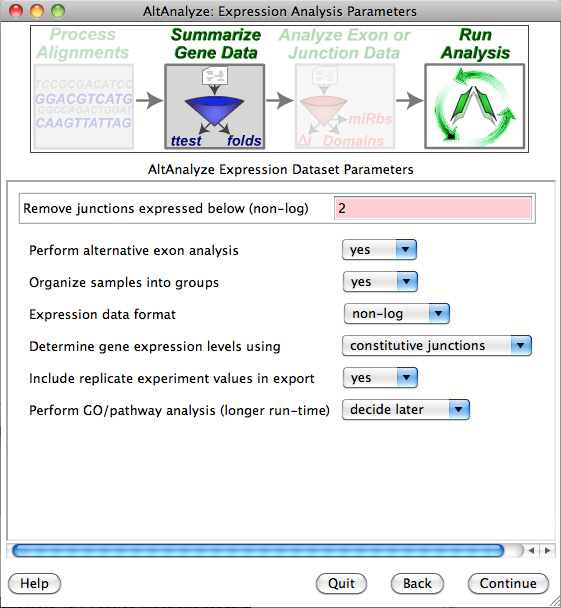
AltAnalyze: Expression Analysis Parameters: Although you can accept the default parameters by clicking “Continue”, it is recommended that you include the option to automatically perform pathway, Ontology and gene-set enrichment analysis (see here for details).
-
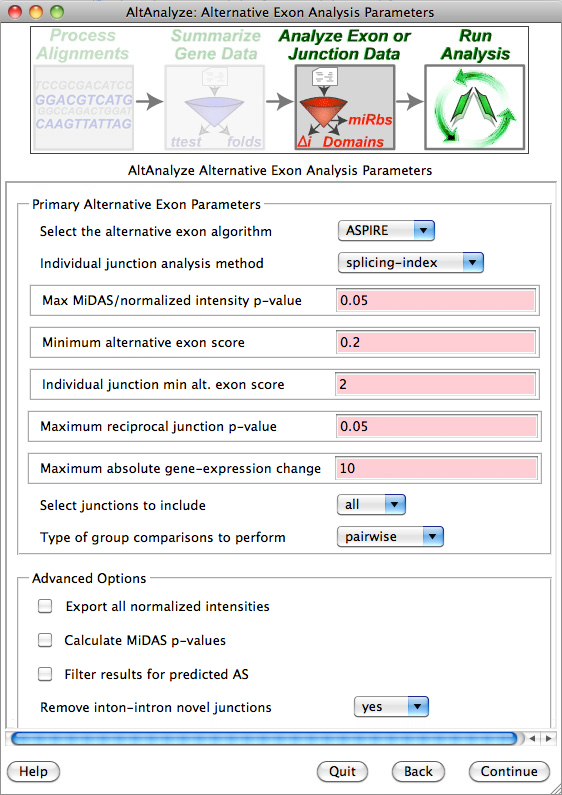
AltAnalyze: Alternative Exon Analysis Parameters: Accept the default parameters by clicking “Continue”.
-
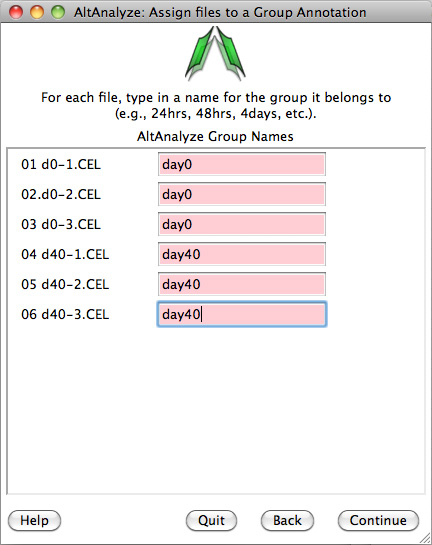
AltAnalyze: Assign BED files to a Group: Type in the group name for each sample (first three are hESC and second three are neural_precursors).
-
AltAnalyze: Establish All Pairwise Comparisons: Selects the groups to compare (neural_precursors vs. hESC).
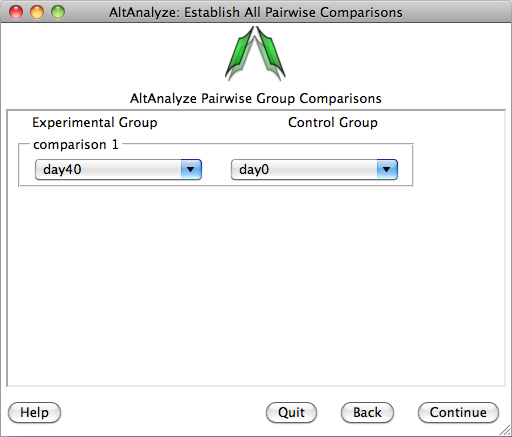
-
A new window will appear that displays the progress of the analysis. Analysis of the sample dataset should take approximately 5 minutes, but can take longer depending upon the machine and operating system. When finished, AltAnalyze will display a new pop-up window, informing the user that the analysis is complete. If analyzing multiple experimental comparisons, these analyses will be run in succession.
-
AltAnalyze: Summary Results: For the last comparison run, overview results are printed to the user interface, including the number of genes with predicted alternative exons, number of genes with predicted domains/motifs and microRNA binding sites affected and number of genes examined. This window will also have the option to Start DomainGraph in Cytoscape. Select this option to immediately open Cytoscape and load your results in DomainGraph (once the DomainGraph database is installed). For more information, click here.
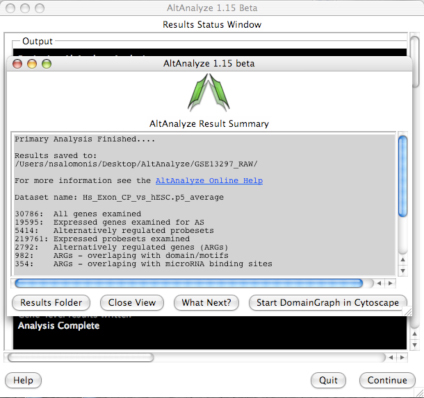
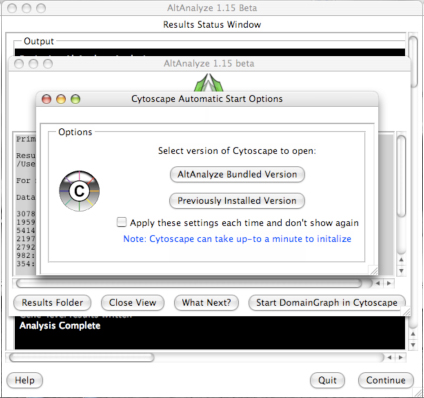
-
Performing GO-Elite Analysis within AltAnalyze: To determine if there are biological pathways (WikiPathways) or Gene Ontology (GO) categories that contain a disproportionate number of alternatively regulated genes, you can use the GO-Elite option in AltAnalyze. GO-Elite performs typical over-representation analysis (ORA), filter-out redundant GO-terms and pathways for publication ready tables, summarize all AltAnalyze statistics at the pathway level and easily view gene annotations for each pathways.
Interpreting the Results
When AltAnalyze was running it produced a number of output files, most to the folder AltResults/AlternativeOutput in the user output directory. These include:
- ExpressionOutput/DATASET-YourExperiment.txt
- AltResults/AlternativeOutput/YourComparison-ASPIRE-exon-inclusion-results.txt
- AltResults/AlternativeOutput/YourComparison-ASPIRE-exon-inclusion-GENE-results.txt
- AltResults/AlternativeOutput/YourComparison-ASPIRE-ft-domain-zscores.txt
- AltResults/AlternativeOutput/YourComparison-ASPIRE-miRNA-zscores.txt
- AltResults/AlternativeOutput/YourComparison-comparison-evidence.txt
These files are tab-delimited text files that can be opened in a spreadsheet program like Microsoft Excel, OpenOffice or Google Documents. In addition to these files, similar files will be produced with the algorithm "splicing-index" (replaces the filename ASPIRE above with splicing-index). These are similar format files with single junction and exon results (as opposed to reciprocal-junction pairs). These results allow users to examine the independent regulation of e exon junctions.
File #1 reports gene expression values for each sample and group based on junctions present in your input BED files. The values are derived from junctions that align to regions of a gene that are common to all transcripts and thus are informative for transcription (unless the option "known junctions" is selected – see “Select expression analysis parameters”, above) and expressed above specified background levels (minimum group average read count). Along with the raw gene expression values (mean read counts), statistics for each indicated comparison (mean expression, folds, t-test p-values) will be included along with gene annotations from Ensembl, including putative microRNA binding sites. This file is analogous to the results file you would have with a typical microarray experiment and is saved to the folder “ExpressionOutput”.
Results from files #2-5 are produced from all junctions that may suggest alternative splicing, alternative promoter regulation, or any other variation indicated by a reciprocal junction analysis for that gene. Each set of results correspond to a single pair-wise comparison (e.g., cancer vs. normal) and will be named with the group names you assigned (groups file). If analyzing multiple groups, the two groups with the largest difference in reciprocal junction scores will be reported along with the conditions these occur in.
File #2 reports reciprocal junctions that are alternatively expressed, based on the user defined ASPIRE or LinearRegression scores and p-values. For each reciprocal junction has several statistics, gene annotations and functional predictions provided. A detailed description of all of the columns in this file is provided here.
File #3 is a summarization of reciprocal-junction results at the gene level from file #2. In addition to this summary, Gene Ontology terms and WikiPathways for that gene are reported.
Files #4 and #5 report over-representation results for protein domains (or other protein features) and microRNA-binding sites, predicted to be regulated by AltAnalyze. These files include over-representation statistics and genes associated with the different domains or features¸ predicted to be regulated.
File #6 compares the reciprocal-junction (e.g., ASPIRE) and exon-level results (splicing-index) to determine which splicing-events are indicated by multiple and independent lines of evidence. The direction of the fold change and algorithm detected by are indicated for each row.
More information about these files can be found in Overview of Analysis Results.
Navigating AltAnalyze Results
AltAnalyze produces a large number of results, including tab-delimited spreadsheets, expression clustered heatmaps and colored pathways. A detailed description of these various outputs can be found here.
Visualizing AltAnalyze Results in DomainGraph
Isoform and domain-level results produced in AltAnalyze (AltResults/DomainGraph) can be directly loaded by DomainGraph. DomainGraph is a plugin for the Java program Cytoscape which can be immediately opened through AltAnalyze. Rather than visualizing junctions, however, DomainGraph currently only supports exon visualization. RNASeq highlighted exons (identified directly from exons or by reciprocal exon-junctions) are associated with Affymetrix Exon 1.0 identifiers to be loaded in DomainGraph. Instructions can be found here.
Gene-Set Enrichment Analysis
AltAnalyze includes the option to perform a powerful biological enrichment analysis, that includes multiple Ontologies, pathways and gene-set categories (e.g., transcription factor targets). This option can be selected from the Expression Analysis Parameters Window by selecting the option "Analyze ontologies and pathways with GO-Elite". From this menu, criterion for filtering your data for differentially expressed genes and visualizing WikiPathway enrichment results are included.