Principal Component Analysis (PCA) in AltAnalyze
In addition to the default pipeline output of two-dimension PCA plots, PCA can be run on its own using multiple customized options. These include optionally displaying sample labels and viewing a PCA plot interactively in two or three-dimensions.
Running PCA
From the AltAnalyze main menu, select your species and platform. Instead of indicating the platform you can also select "Other ID" as the data type and the gene system you are analyzing as the "platform ID". Select Continue and then Additional Analyses. From here, select Principal Components to see the options for loading your input ID file.
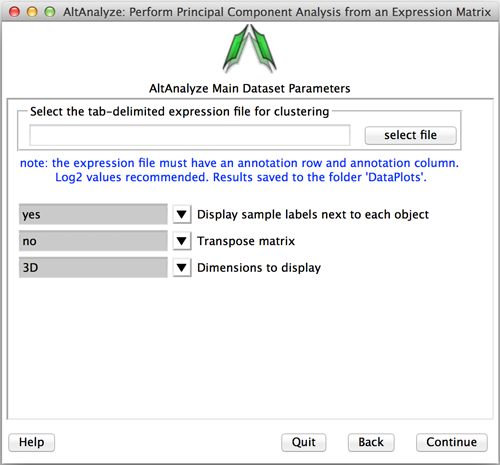
The input file is an expression matrix. If you have already run AltAnalyze all significantly changed genes from AltAnalyze can be selected from the file ExpressionOutput/Clustering/SampleLogFolds-MyDataset.txt. It is recommended that sample names belonging to different groups have the group name included as (GroupName:SampleName). PCA will typically take anywhere from 10 seconds to an hour depending on the size of the dataset (50 genes to 20,000).
To run:
- From the PCA menu, select the input file.
- Choose to display the sample names next to each sample or not.
- Choose to transpose the input expression matrix file.
- Choose 2D or 3D PCA visualization (first 2 or 3 components).
- Select Continue to run.
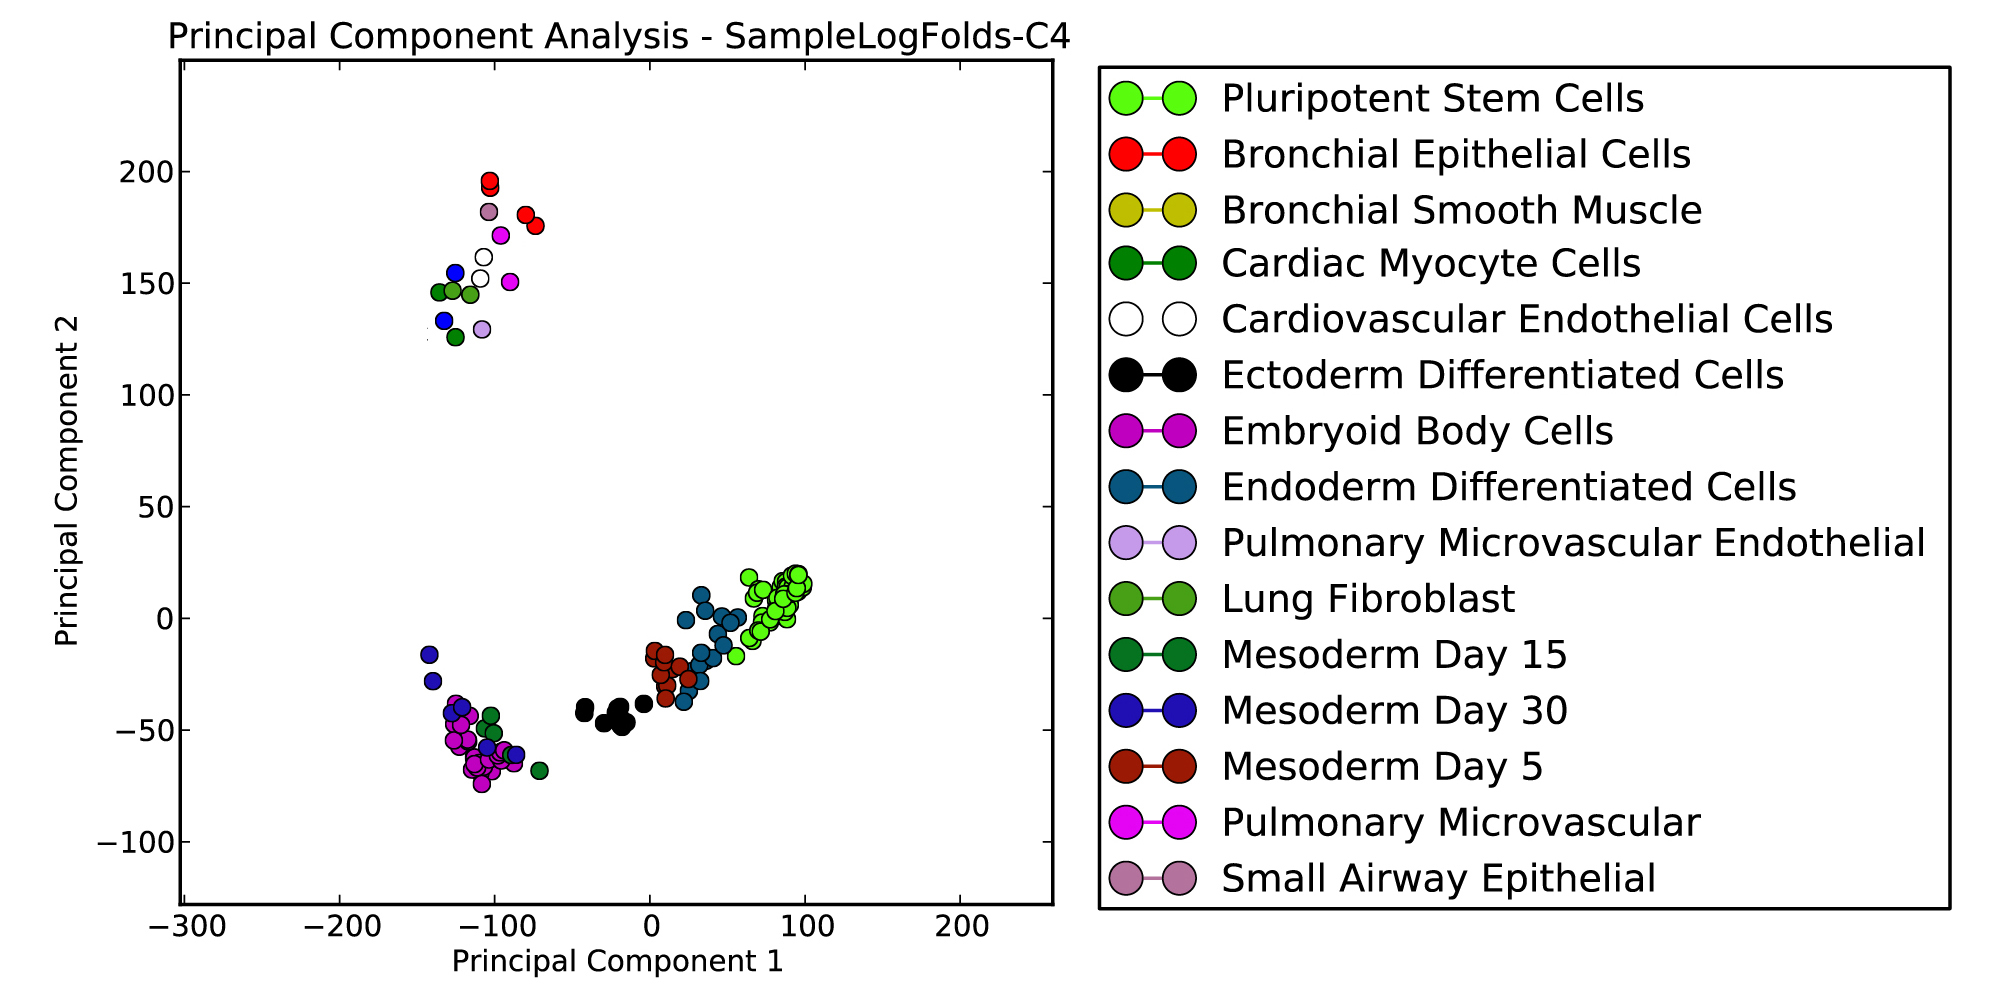
A new plot will appear that you can resize. A PDF output and PNG output of this plot will be saved to the folder DataPlots in the file in which your input folder is or in the main AltAnalyze results directory.