Lineage Profiler Analysis Program
Overview
LineageProfiler is a program used to identify the most likely cell types and tissues represented in a given RNA sample. These results are then visualized as association scores at the level of hierarchically clustered cell types and curated lineage networks. This software can be applied to microarray and RNA-Seq profiling data. While this tool is integrated with the full AltAnalyze analysis workflows, it can also be run independently on data processed outside of AltAnalyze (see documentation).
Analysis Method
To derive correlation scores to different cell types and tissues (lineages), a database is created reflecting the most specifically-expressed genes or exons present in a particular lineage, relative to all lineages types examined (ranging from 50 to 150). The resulting database is a small subset of the original, containing the most informative markers. Data from a user RNA-profile is compared to the profile of each lineage just for these markers to derive correlation coefficients and resulting Z scores based on the distribution of values for each user RNA-profile. Z scores to each lineage are calculated from the distribution of Pearson correlation coefficients, specifically for each sample or condition analyzed.
Lineage differences between conditions is specifically evaluated via GO-Elite using the database of lineage specific markers for examined differentially expressed genes.
Input Data
LineageProfiler is compatible with four types of input data:
- Gene expression values (probe intensity or read-counts)
- Exon expression values (probe intensity or read-counts)
- Gene expression p-values or calls
- Exon expression p-values or calls
Visualization
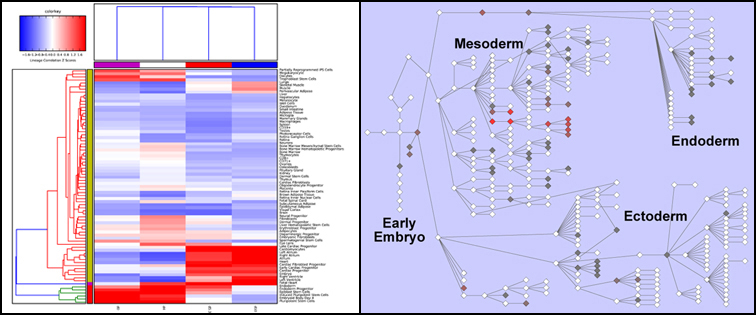
Results from LineageProfiler are automatically viewed upon a Hierarchically clustered heatmap and on a Lineage network from WikiPathways. For both, correlation based Z scores are visualized as positive associations (red) and negative associations (blue - only for hierarchically clustered results). The community curated Wikipathway can be accessed here.
Databases
Expression compendium database are currently derived using the following platforms:
- Affymetrix Exon 1.0 arrays (Human and Mouse)
- Affymetrix Gene 1.0 arrays (Human and Mouse)
- Affymetrix 3' arrays (Human Only)
Similar results have been obtained using each of these platforms to different array platforms or RNA-Seq. Different cell and tissue content is represented in each, based on availability in GEO.
Note: In the initial release of this software (AltAnalyze version 2.0.7), only gene expression values are supported with only one database for mouse and human (Gene or Exon array, respectively), however all will be supported in subsequent releases.
Example Results
under construction
Software and Database Design
To derive lineage correlations and resulting scores in LineageProfiler, expression values or presence calls are compared to similar values in a reference database of cell types and tissues. Although each compendium database is built from a specific transcriptome profiling platform, these have been found to effectively work in profiling lineages from various microarray and RNA-Seq platforms.
Currently, the reference lineage databases for mouse and human are derived from a collection of over 70 unique tissues and cell types collected from online public repositories (Affymetrix and GEO). For mouse, the default database is derived from a compendium of Affymetrix Gene 1.0 array data, while human is Affymetrix Exon 1.0. These were selected since they contained the highest quality and most specific gene probe content for that species and also contained the most diverse tissue and cell representation.
Building the Lineage Marker Databases
Rather than representing all genes in the final LineageProfiler correlation database, only a subset of genes representing the most tissue or cell-type specific (lineage) markers are determined and retained. To identify these markers, the compendium samples for each array are first assigned to distinct levels in a lineage hierarchy by manual curation. This is required since there is significant overlap between unique RNA sample groups. An example is heart:
- Level 1 adult heart
- Level 2 fetal heart
- Level 3 left ventricle
- Level 3 atria
- Level 4 cardiac progenitor
When identifying the top-predictive markers for each cell type or tissue, the compendium samples are compared to an idealized lineage-specific profile (no expression in any samples except in the lineage of interest) via Pearson correlation. First, Level 1 lineages are examined to derive final ranked correlations for each tissue or cell-type. Next, Level 2 lineage values are combined with Leve1 1 and analyzed to obtain final ranked correlations for all Level 2 lineages. This is repeated, with each group of cells and tissues compared to Level 1, which is typically composed of a more heterogeneous population of cells. In this way, lower level lineages are required to have more specific expression profiles than the higher the first level. The top 60 markers are obtained for each lineage and stored. The final database is composed of all top markers. When correlated unknown samples to this database, all common genes in the user and lineage database are compared via direct Pearson correlation to obtain a correlation coefficient. In this way, the original lineage marker associations can not bias any unknown sample correlations since all genes are considered.
The lineage-specific markers obtained during the build process, conform to well described cell and tissue markers as well as including previously un-implicated markers. The specific marker genes for each lineage are currently used only for GO-Elite analysis, to identify enriched lineages for given comparisons.