How can I graph my splicing scores for all exons in a gene?
Answer: There are several ways you can graph your exon data. One of the most basic and simple is to simply load your exon data into DomainGraph, where all expressed probesets will be visualized that meet your initial thresholds.
A more quantitative way to view you gene data is view the expression values for each exon directly or view the splicing-index or FIRMA fold changes for each exon in a gene. Below is an example of visualization the expression of each exon in a gene for the two conditions.
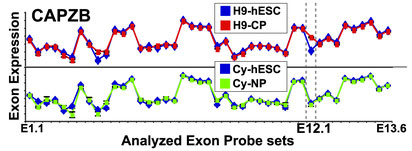
Here expression values are grouped as designed and an average expression value is plotted as a line graph in Excel for the two means, for all exons. To get such values, you can simply run AltAnalyze on your CEL files by setting the option "Perform an alternative exon analysis" to "no" and run AltAnalyze.
This will just produce the AltAnalyze RMA expression file (in addition to others) in the folder ExpressionInput with the prefix "exp.", which you can import into a database program such as Microsoft Access or programmatically import. In addition to this file, you will need to import the probeset annotation file in "AltDatabase/EnsMart55/Hs/exon/Hs_Ensembl_probeset.txt (adjust directories based on the species and array-type). From this second file, you can import exon IDs, probeset coordinates and splicing annotations. By exporting this data for each gene of interest, the user can create the graph above.
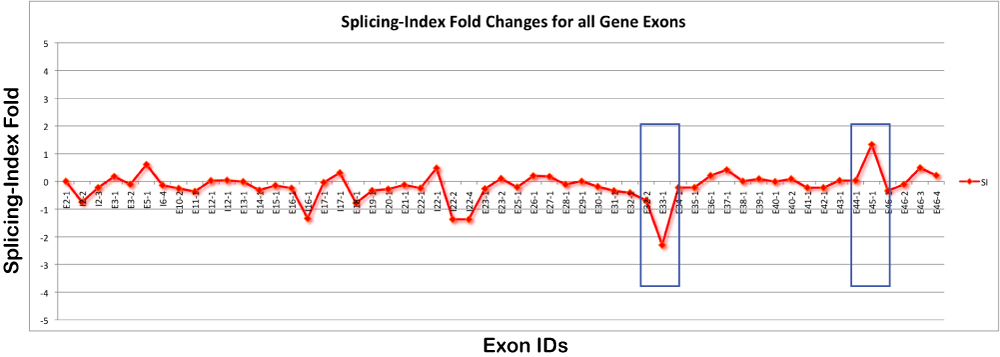
If a user is interested in displaying a graph of splicing-index or FIRMA folds for each exon in a gene, the user can run a typically AltAnalyze analysis, with addition of some custom filtering options.
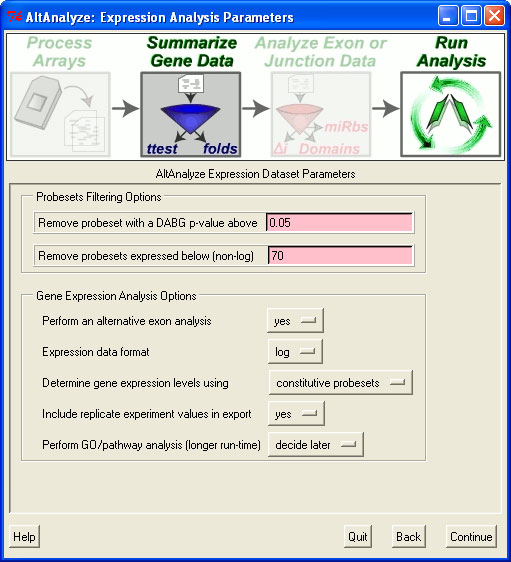
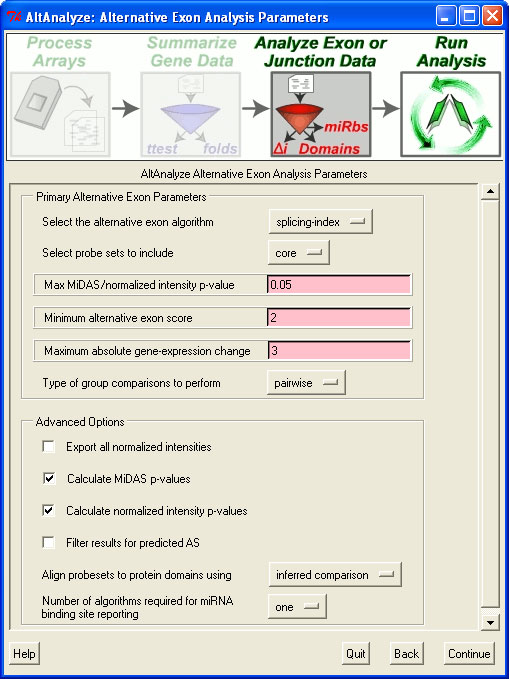
First, the user will want to make sure to not filter the probeset data (in order to show all exons). In the "Expression Analysis Parameters" window, shown above, this requires setting the minimum DABG p-value to 1 and the maximum non-log expression 1. In the next window, "Alternative Exon Analysis Parameters", the user should set the probesets to include equal to "full" and select the option "Export all normalized intensities".
After running this program, the user will need to import the normalized intensity file in the results folder under AltResults/RawSpliceData/splicing-index/Hs (adjusted as appropriate) into a database program such as Microsoft Access or programmatically import. In addition to this file, you will need to import the probeset annotation file in "AltDatabase/EnsMart55/Hs/exon/Hs_Ensembl_probeset.txt (adjust directories based on the species and array-type). From this second file, you can import exon IDs, probeset coordinates and splicing annotations. By exporting this data for each gene of interest, the user can create the graph above.