Overview
AltAnalyze consists of more than 30 modules and over 10,000 lines of code. The core modules for AltAnalyze consist of the programs ExpressionBuilder and AltAnalyze, which can be used in tandem or separately through the AltAnalyze GUI. The user will never likely need to deal directly with these modules names when running AltAnalyze, but these distinct core modules are used for different analysis functions (Figure 5.1).
Figure 5.1
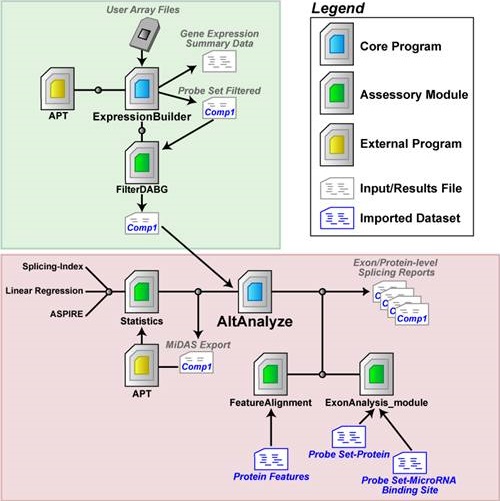
AltAnalyze Analysis Pipeline: The AltAnalyze workflow is depicted, using Affymetrix arrays as an example (for RNA-Seq data, substitute RNA-Seq alignment files for CEL file and exon/junction for probe set). The transparent green box highlights functions performed by the ExpressionBuilder module of AltAnalyze whereas the transparent red box highlights the AltAnalyze module. (A) User microarray data (probe set expression values and DABG p-values) or CEL files are imported into AltAnalyze via the ExpressionBuilder module, which separates data for different biological array groups into user designated pairwise comparisons (e.g., cancer vs. normal). For each pairwise comparison, probe set expression values and DABG p-values are exported to separate files, and then analyzed by the module FilterDABG to exclude probe sets with poor detection parameters. The resulting files are inputs for alternative exon analysis. In parallel, a gene expression summary file is produced with Ensembl gene level expression values (based on constitutive probe set expression) for each gene and array along with summary statistics (average expression, fold, and t-test p-value for all pairwise comparisons) and annotations. (B) Using the ExpressionBuilder pairwise comparison files, AltAnalyze re-calculates constitutive expression values, evaluates changes in probe set expression relative to constitutive (statistics module), and links probe sets with “significant” changes to aligning alternative protein sequence and predicted changes in protein and miR-BS architecture (ExonAnalyze and FeatureAlignment modules). The result is a series of probe set and gene summary files along with over-representation statistics for the regulation of protein and miR-BS features. Optionally, probe set and constitutive expression values can be exported to the bundled application Affymetrix Power Tools to calculate additional alternative exon statistics to be included in the AltAnalyze analysis.
The ExpressionBuilder component builds constitutive gene expression summary files as well as filters the exon, junction or probe set or probe set expression data prior to alternative-exon analysis. The AltAnalyze module performs all of the alternative-exon analysis and MiDAS p-value calculations.
ExpressionBuilder Module
The ExpressionBuilder program is principally designed to perform the following tasks:
-
Import user expression data from tab-delimited files.
-
(Alternative Exon Analysis) For Affymetrix arrays, exclude probe sets where no samples have a DABG p
user-threshold. For RNA-Seq, this module filters out exons or junctions where no samples have a read count > user-threshold (e.g., 2 reads). -
Organize your data according to biological groups and comparisons (specified by the user from custom text files).
-
(Alternative Exon Analysis) Calculate gene transcription levels for all Ensembl genes.
-
Export calculated gene expression values along with folds, t-test and f-test p-values and gene annotations for all genes and all user indicated comparisons.
-
(Alternative Exon Analysis) Export all gene-linked feature expression and DABG data for all pairwise comparisons for further filtering (next step).
-
(Alternative Exon Analysis) Filter the resulting feature data using mean expression values and probabilities specific for each pairwise comparison and user-defined thresholds (Figure 2.6).
The above tasks are performed in order by the ExpressionBuilder module. Detection probabilities are assessed at two steps (2 and 7). In step 2, import of DABG p-values are for the purpose of calculating a transcription intensity value only for those constitutive features (present in all or most transcripts) that show detection above background, since some probe sets will have weaker expression/hybridization profiles as others for Affymetrix analyses and some junction counts are too low to be considered biologically significant for RNA-Seq. If no features have a DABG p-value less than the default or user supplied threshold (for at least one sample in your dataset), all selected features will be used to calculate expression (constitutive aligning only if default is selected).
In step 7, the probe set DABG p-values are examined to include or exclude features for alternative splicing analysis. This step is important in minimizing false positive splicing calls. False positive splicing calls can occur when a feature is expressed below detectable limits and results in a transcription-corrected expression value that artificially appears to be alternatively regulated. For Affymetrix expression and DABG p-value files output from APT, probe set expression values are initially filtered to remove any probe sets where the expression and dabg p-values are below the user defined threshold for all biological groups examined and export all pairwise comparison group files (expression and dabg) for further filtering. For rcond or probe sets used to determine gene expression levels (constitutive or known exons), the module FilterDABG is used to remove features that are expressed below user defined thresholds (expression and dabg) in the two comparison groups for all pairwise comparisons. If a feature is not used to determine gene expression levels, then for at least one of the two biological groups, the same criterion must be true (mean DABG p-value and expression). These filters ensure that: 1) the gene is “expressed” in both conditions and 2) the feature is “expressed” in at least one condition. The feature and expression values passing these user defined filters are exported to a new file that is ready to use for splicing analyses, stored to the user output directory under “AltExpression/ExonArray/*species*”. This file can also be directly selected in future AltAnalyze runs as input for analysis (“AltAnalyze filtered file” - Figure 2.4).
Runtime of ExpressionBuilder is dependent on the number of conditions and array type being analyzed (10 minutes plus for Affymetrix Exon 1.0 ST arrays). When analyzing junction-only RNA-Seq data, runtime is relativity fast (1-5 minutes), since the sequence space (pre-aligned junctions) is less than exon and junction tiling arrays. However, analysis of combined exon and junction RNA-Seq data is typically longer and more memory intensive than Affymetrix junction arrays. If multiple comparisons are present in a single expression file, input files for AltAnalyze will all be generated at once and thus runtimes will take longer.
Note 1: While this pipeline is mainly for use with alternative exon/junction platforms, it is also compatible with a standard 3’ Affymetrix microarray dataset to calculate folds, t-test p-values, and assign annotations to this data. This is useful when you have many comparisons in your dataset and you don’t wish to manually calculate these values.
Note 2: You do not need to run ExpressionBuilder if you have an alternative way of building AltAnalyze input files for Affymetrix arrays. To do so, your file headers for each arrays must have the name “group:sample_name”, where your group names are different for each group and the denominator group is listed first and the numerator is listed second. Below the header line should only be probe set IDs and log2 expression values.
AltAnalyze Module
The AltAnalyze module is the primary software used for all alternative exon analyses. This software imports the filtered expression data and performs all downstream statistical and functional analyses. This program will analyze any number of input comparison files that are in the “AltExpression” results directory for that array type. The main analysis steps in this program are:
-
Import exon or junction annotations, to determine which exon, junctions or probe sets to analyze, which are predicted constitutive and which correspond to known AS or APS events.
-
Import the user expression data for the pairwise comparison.
-
Store feature level data (e.g., junction or probe set) for all features corresponding to either a constitutive exon (or junction) or for splicing event, while storing the group membership for each value.
-
Calculate a constitutive expression value for each gene and each sample (used for the splicing score later on). OPTIONAL: If the user selected a cut-off for constitutive fold changes allowed to look at alternative exon regulation, then remove genes from the analysis that have a gene-expression difference between the two groups > cut-off (up or down).
-
(Alternative Exon Analysis Only) OPTIONAL: exports input for the Affymetrix Power Tools (APT) program to calculate a MiDAS p-value for each probe set or RNA-Seq feature.
-
Calculate a splicing score and t-test p-value from the junction or probe set and constitutive expression values. This calculation requires that splicing ratios are calculate for each sample (exon/constitutive expression) and then compared between groups. For exon arrays, the splicing index method (SI) is calculated for each probe set. For junction analyses, ASPIRE, Linear Regression are used with the pre-determined reciprocal junctions or alternatively are calculated for individual features using the SI method.
-
(Junction Analysis Only) OPTIONAL: performs a permutation analysis of the sample ASPIRE input values or Linear Regression values to calculate a likelihood p-value for all possible sample combinations.
-
Retain only features meeting the scoring thresholds for these statistics (splicing score, splicing t-test p, permutation p, MiDAS p - see Algorithm Descriptions).
-
Import feature-protein, feature-domain and feature-miRNA associations pre-built local from flat files (see Building AltAnalyze Annotation Files).
-
For the remaining features, import all protein domain and miR-BS to all pre-built feature associations (see Probe Set Filtering for details). Import all feature-domain and -miR-BS associations for all genes to calculate an over-representation z-score for all domains and miR-BS’s along with a non-adjusted and adjusted p-value. Export the resulting statistics and annotations to tab-delimited files in the “AltResults/AlternativeOutput” folder in the user-defined output directory.
-
(Junction Analysis Only) Import splicing and exon annotations for regulated exons corresponding to each set of reciprocal junctions (e.g. for E1-E3 compared to E1-E2, E2 is the regulated exon). These annotation files are the same as those for exon arrays, except that the probe set is replaced by the exon predicted to be regulated by the reciprocal junction-pair (see Building Ensembl-Exon Associations).
-
For protein domain and miR-BS annotations, reformat the direction/inclusion status of the annotation. For example, if a kinase domain is only found in a protein that aligns to a exon, junction or probe set, but was down-regulated, then the annotation is listed as (-) kinase domain, but if up-regulated is listed as (+) kinase domain.
-
Export the results from this analysis to the “AltResults/AlternativeOutput” folder in the user-defined output directory.
-
Summarize the probe set or reciprocal junction data at the level of genes and export these results (along with Gene Ontology/Pathway annotations).
-
Export overall statistics from this run (e.g. number of genes regulated, splicing events).
-
(Junction Analysis Only) Combine and export the exported feature and gene files for each comparison analyzed, to compare and contrast differences.
Result File Types
When finished AltAnalyze will have generated five files:
-
name-scoringmethod-exon-inclusion-GENE-results.txt
-
name-scoringmethod-exon-inclusion-results.txt
-
name-scoringmethod-ft-domain-zscores.txt
-
name-scoringmethod-miRNA-zscores.txt
-
name-scoringmethod-DomainGraph.txt
Here, “name” indicates the comparison file name from ExpressionBuilder, composed of the species + platform_name + comparison_name (e.g. Hs_Exon_H9-CS-d40_vs_H9-ESC-d0), “scoringmethod” is the type of algorithm used (e.g. SI) and the suffix indicates the type of file.
The annotation files used by AltAnalyze are pre-built using other modules with this application (see Building AltAnalyze Annotation Files). Although the user should not need to re-build these files on their own, advanced users may wish to modify these tables manually or with programs provided (see Required Files for Manual Update).
For protein-level functional annotations (e.g., domain changes), this software assumes that if an exon is up-regulated in a certain condition, that the protein domain is also up-regulated and indicates it as such. For example, for exon array data, if a probe set is up-regulated (relative to gene constitutive expression) in an experimental group and this domain is found in the protein aligning to this probe set, in the results file this will be annotated as (+) domain. If the probe set were down-regulated (and aligns as indicated), this would be annotated as (-) domain.