Program Description
AltAnalyze http://altanalyze.org is a freely available, easy-to-use, cross-platform application for the end-to-end analysis of microarray, RNA-Seq, proteomic, metabolomic and other quantitative datasets. These analyses include QC, gene-expression summarization, alternative exon/junction identification, expression clustering, single-cell analysis, PCA, network analysis, cell type and sample classification, alternative exon visualization, batch effects removal, ID-mapping, Venn diagram analysis, pathway/TF target enrichment and pathway visualization. For splicing-sensitive platforms (RNA-Seq and Affymetrix Exon, Gene and Junction arrays), AltAnalyze specializes in evaluating changes in protein sequence, domain composition, and microRNA targeting that result from differential isoform expression. To do this, AltAnalyze associates user sequence-level changes in exon or junction expression that lead to the alternative expression of associated mRNAs. This software requires no advanced knowledge of bioinformatics programs or scripting. Once the analysis is complete, a user-friendly Results Viewer can be run as an independent program or directly from AltAnalyze. As input from RNA-Seq experiments, AltAnalyze accepts raw RNA sequence files, aligned BAM files, genomic aligned exons and junctions from several external packages, or previously normalized expression values. For Affymetrix analyses, all that is required are your microarray files or a list of regulated probe sets along with some simple descriptions of the conditions that you’re analyzing. Step-by-step tutorials are available from our support site at http://www.altanalyze.org.
AltAnalyze is composed of a set of modules designed to (A) summarize, organize and filter exon and junction-level data; (B) annotate and calculate statistics for differential gene expression, (C) calculate scores for alternative splicing (AS), alternative promoter selection (APS) or alternative 3’ end-processing; (D) annotate regulated alternative exon events (e.g., mutually-exclusive splicing); and (E) assess downstream predicted functional consequences at the level of protein domains, microRNA binding sites (miR-BS) and biological pathways. The resulting data will be a series of text files (results and over-representation analyses) that you can directly open in a computer spreadsheet program for analysis and filtering Figure 1.1. Graphical QC plots, hierarchical clustering heatmaps, PCA, network diagrams, exon expression graphs and pathway diagrams are also produced. In addition, export files are created for the Cytoscape[Cline2007] program DomainGraph to graphically view domain and miR-BS exon alignments and AltAnalyze statistics, however, these can now also be viewed in AltAnalyze directly through the AltAnalyze Viewer using a new tools called Subgene Viewer.
Figure 1.1
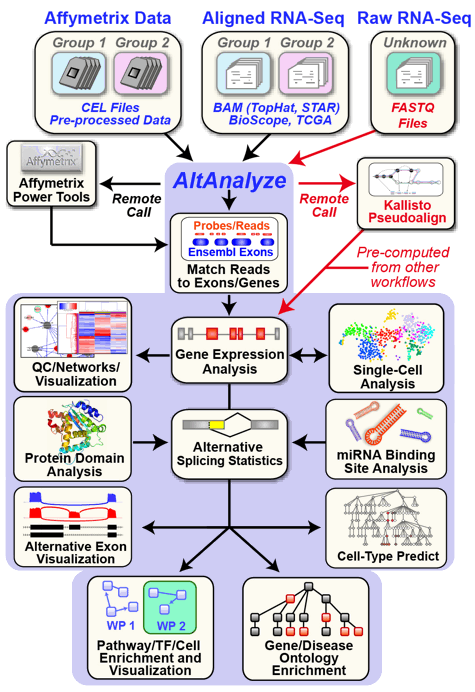
AltAnalyze Overview: Simplified graphic illustration of the analysis steps and output files produced by AltAnalyze. All of these results can be easily browsed from using the AltAnalyze Results Viewer.
Alternative exon analysis is currently compatible with the RNA-Seq unaligned and aligned exon and junction data, Affymetrix Exon 1.0 ST, Affymetrix Gene 1.0 ST, Affymetrix HJAY, HTA2.0, MJAY, hGLUE, HTA2.0 arrays and the custom exon-junction Affymetrix AltMouse A array, however, data from other platforms can be imported if supplied in BED format for over 50 species (see Pre-Processing, External Files and Applications). Analysis of these and conventional Affymetrix microarrays is supported for array normalization (RMA), batch effects removal (combat), calculation of array group statistics, dataset annotation and pathway over-representation analysis. For non-Affymetrix arrays, all these steps are supported with exception to array normalization.
Updates
For past and current updates, see Update History and News.
Implementation
AltAnalyze is provided as a stand-alone application that can be run on Windows or Mac OS X operating systems, without installation of any additional software. This software is composed of a set of distinct modules written entirely in the programming language Python and distributed as stand-alone programs and source-code. Python is a cross-platform compatible language; therefore, AltAnalyze can be run on any operating system that has Python and Tkinter for Python installed. On many operating systems, including Linux and any Mac OS X operating systems the necessary python components are included by default, however, on some operating systems, such as Ubuntu, Tkinter may need to be installed when using the graphical user interface. AltAnalyze can be run from either an intuitive graphic user interface or from the command-line. Additional source-code dependencies can be optionally installed to support additional visualization options. To run AltAnalyze from source-code, rather than through the compiled executables, see Installation and Running AltAnalyze from the Graphical User Interface for more information. Note: some features may not be compatible with all executable operating system versions.
Requirements
The basic installation of AltAnalyze requires a minimum of 1GB of hard-drive space for all required databases and components. Species databases are downloaded separately by the user from within the program, for various database versions. Species gene databases, Affymetrix library and annotation files can all be automatically downloaded by AltAnalyze. A minimum of 4GB of RAM and Intel Pentium III processor speed are further required. At least an additional 1GB of free hard-drive space is recommended for building the required output files. Additional RAM (up to 16GB) and hard-drive space (up to 4GB free) is recommended for large exon or junction studies.
Installation
Prior to downloading AltAnalyze, determine the version that is appropriate to use for your operating system (e.g., Win64 for Windows, OSX for Mac). The operating system specific applications will include all necessary dependencies. If this application fails to run, we recommending downloading the source-code version and installing any necessary dependencies (see Source-Code Version). For RNA-Seq analyses, it is essential to know the genome version your sequences were aligned against and which Ensembl databases support these versions in AltAnalyze. See the Ensembl website (http://ensembl.org) for details.
Compiled Stand-Alone Version
Download the installer package (Mac OS X) or zip archive to your machine. To install on Mac OS X, double-click on the dmg to mount the AltAnalyze disk image to your Desktop. After opening the disk image, drag the folder “AltAnalyze” to any desired directory. For zip archives, extract the archive file to any accessible location using the appropriate zip extraction tool (e.g., WinZip, default tool). Once extracted, open the AltAnalyze program directory and double-click on the file named “AltAnalyze” to start the GUI.
Source-Code Version
When using AltAnalyze in headless mode (command-line only, see Running AltAnalyze from the Command-Line), only Python is required (Python 2.6 or 2.7 is recommended). When using the GUI, both Python and Tkinter are required at a minimum. Tkinter is typically installed with Python but is not included with some Linux implementations (e.g., Ubuntu), unless manually installed. Scipy is optional (improves performance when performing a Fisher Exact Test). Numpy and MatPlotLib are required for all quality control and clustering analyses and visualization. To support WikiPathways visualization, install the python web service client package lxml. If the Python imaging library Pillow is installed direct visualization of pathways in the GUI is supported as opposed to with the default operating system PNG image viewer. Additional dependency information and instruction details can be found in Stand-Alone Dependencies.
Extract the zip archive to any accessible folder. From a command-prompt change directories to the AltAnalyze program folder and enter python AltAnalyze.py to initiate the GUI. For headless-mode, supply AltAnalyze with the appropriate command-line arguments (see the end of Running AltAnalyze from the Command-Line).
Pre-Processing, External Files and Applications
RNA Sequence Alignment Data
Several options now exist for importing RNA-Seq data into AltAnalyze, including the direct alignment of raw RNA-Seq as well as alignment result files. See Obtaining RNASeq Input Files to see which method best suits your data. In general, we recommend TopHat2/BowTie2 as a sensitive method for obtaining known and novel junctions, in addition to exon-spanning reads.
The latest versions of AltAnalyze support direct alignment of RNA-Seq fastq or fastq.gz format files, using the extremely fast and lightweight tool kallisto. As kallisto’s license has some restrictions, please read before using this option. Gene and isoform level results are generated from kallisto, but not exon and junction.
When analyzing data from already aligned RNA-Seq reads, AltAnalyze can import data in the BAM alignment file (.bam) produced by the TopHat or STAR software, UCSC BED format, as output from the Applied Biosystems software BioScope, or junction expression files supplied by the Cancer Genome Atlas (TCGA). The junction BED file can be produced by various RNA-Seq exon-exon junction alignment applications, including TopHat (junction.bed), HMMSplicer (canonical.bed) and SpliceMap (junction_color.bed). These files provide genomic coordinates and corresponding aligned read counts for unique junctions. For AltAnalyze, all junction BED files must be given unique names and saved to a single folder for an experiment (minimum of two files belonging to two different experimental groups). When processing BAM files, both junction and exon format BED files will be produced from each BAM. Upon import, AltAnalyze will match the splice-site coordinates of each junction to Ensembl and UCSC mRNA annotated exon-junctions, individual exon splice sites, exons and introns. AltAnalyze will also identify trans-splicing events, where an aligned junction contains splice sites found with two distinct genes. If neither splice site of detected junction aligns to an Ensembl gene (between the first and last exons), the junction will be excluded from the analysis. Junctions and corresponding read counts will be saved to the folder “ExpressionInput” (user-defined output directory), with re-assigned standard AltAnalyze IDs (e.g., ENSMUSG00000033871:E13.1-E14.1). Reciprocal junctions will be analyzed for any known or novel junction predicted to alternatively regulate an associated exon (see Reciprocal Junction Analysis). For SOLiD sequencing, a viable alternative to these methods is the software BioScope, which produces both exon and junction expression estimates. The counttag (exon-level) and alternative-splicing (junction-level) files can be loaded once the extension Is changed from .txt to .tab. For junction count files from the TCGA, after downloading to your hard-drive, the extension “.junction_quantification.txt” must be added to all files for AltAnalyze to recognize the proper input format.
AltAnalyze can process raw Affymetrix image files (CEL files) using the RMA algorithm. This algorithm is provided through Affymetrix Power Tools (APT) binaries that are distributed with AltAnalyze in agreement with the GNU distribution license (see agreement in the AltDatabase/afffymetix/APT directory). Alternatively, users can pre-process their data outside of AltAnalyze to obtain expression values using any desired method. Example methods for obtaining such data include ExpressionConsole (Affymetrix) and R (Bioconductor), either of which can be used if the user desires another normalization algorithm rather than RMA (e.g., GC-RMA, PLIER, dCHIP). Likewise, users with non-Affymetrix data can use an appropriate normalization method (e.g. Chipster). FIRMA alternative exon analysis is only supported when users have previously analyzed CEL files for the dataset of interest, since FIRMA scores are calculated from RMA probe-level residuals, rather than probe set expression values.
If alternative exon, gene or junction Affymetrix CEL files are processed directly by AltAnalyze (using APT and RMA), two files will be produced; an expression file (containing probe set and expression values for each array in your study) and a detection above background (DABG) p-value file (containing corresponding DABG p-values for each probe set). As mentioned, if FIRMA is selected as the alternative exon analysis algorithm, APT will first perform a separate RMA run to produce probe residuals for gene-level metaprobesets (Ensembl associated AltAnalyze core, extended or full probe sets). The results produced by AltAnalyze will be identical to those produced by APT or ExpressionConsole. For some exon arrays, users can choose to exclude certain array probes based on genomic cross-hybridization (see Running AltAnalyze from the Command-Line).
For array summarization, all required components are either pre-installed or can be downloaded by AltAnalyze automatically (Affymetrix library and annotation files) for most array types. If the user is prompted for a species library file that cannot be downloaded, the user will be asked to download the appropriate file from the Affymetrix website. Offline analyses require the user to follow the instructions in Running AltAnalyze from the Command-Line.
Agilent Feature Extraction Files
AltAnalyze directly process Agilent Feature Extraction files produced from Agilent scanned slide images using Agilent’s proprietary Feature Extraction Software. Feature Extraction text files can be loaded in AltAnalyze using the Process Feature Extraction Files option and selecting the appropriate color ratio or specific color channel from which to extract expression values from. Quantile normalization is applied by to Agilent data processed through this workflow.
Other Splicing-Sensitive Platforms
With the latest version of AltAnalyze (version 2.0.3 and later), any user exon and junction expression data can be imported into AltAnalyze. This is accomplished by treating the input expression data the same as the RNA-seq input files (i.e., stored as junction or exon coordinates and counts in the UCSC BED format). Analyses, annotations and results are the same as with RNA-seq data. See Junction BED Format and Exon BED Format for sample inputs.
Other Quantitative Expression Data
Previously normalized or non-normalized expression values for any experimental data can also be imported into AltAnalyze for analysis. Most analytical functions will be available provided the data is formatted in a compatible manner (e.g., log2, non-zero values). Non-normalized data can be directly normalized in AltAnalyze using the quantile normalization option. When loading gene, protein, RNA or metabolite associated data, biological annotations, pathway enrichment analysis, network visualization and pathway visualization options are also supported. Simply select the Data Type Other IDs from the Main Menu (see Running AltAnalyze from the Graphical User Interface) and the appropriate identifier system from the platform selection pulldown.
Help with AltAnalyze
Additional documentation, tutorials, help, and user discussions are available in Tutorials. Downloads, tutorials and help for DomainGraph can be found at http://domaingraph.bioinf.mpi-inf.mpg.de.