AltAnalyze Hierarchical Clustering Heatmaps
Hierarchical clustering in AltAnalyze is a useful way to quickly visualize expression patterns from high-dimensional datasets, similar to Cluster/TreeView TreeView (BAD LINK!). In fact, AltAnalyze can call TreeView. Similar to other tools, there are many options for coloring, clustering algorithms available and normalization options. However, there are a number of unique and powerful options in this tool. These include filtering on specific genes or pathways, getting correlated genes and finding optimized clusters for single cell analysis. For clustering, the HOPACH method in R optionally available, simply if you already have R and bioinconductor installed (must be registered in the system path on Windows). Hierarchical clustering can be run in one of two ways:
- Through analysis of raw array or RNA-Seq data (Workflow Analysis)
- Immediate analysis of filtered fold files (Additional Analyses)
- Through the Predict Groups function (See Tutorial)
This method is limited in that you can not currently zoom in to the clusters or interactively navigate the heatmaps.
Visualization Support
When using the AltAnalyze pre-compiled distributions, no additional software is needed. When running from the source code, support for heatmap visualization and hierarchical clustering is provided through the Python libraries matplotlib, scipy, numpy and optionally fastcluster (see here for more detail).
Customized Independent Analysis (Additional Analyses)
From the AltAnalyze main menu, select your species and platform. Instead of indicating the platform you can also select "Other ID" as the data type and the gene system you are analyzing as the "platform ID". Select Continue and then Additional Analyses. From here, select Hierarchical Clustering to see the options for loading your input ID lists to compare.
The input tab-delimited text file must have a header row of column annotations (e.g. sample names) and the first column with row annotations (e.g. gene names) and the remaining by positive and negative values. Multiple options for positive and negative gradients can be selected, along with clustering algorithms for rows and columns.
Figure 1
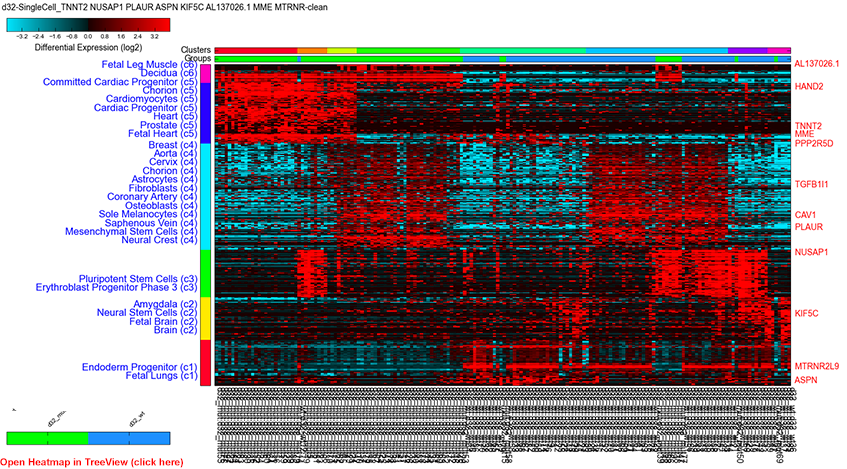
Single cell expression clustering via driver gene analysis: Parameters, PCA stored derived gene-set, positive, top correlated genes (rho>0.4) with driver identification and BioMarker enrichment analysis.
Menu and Formatting Options
The below options are present in the program and can also be programmatically controlled using the command-line interface.
Figure 2
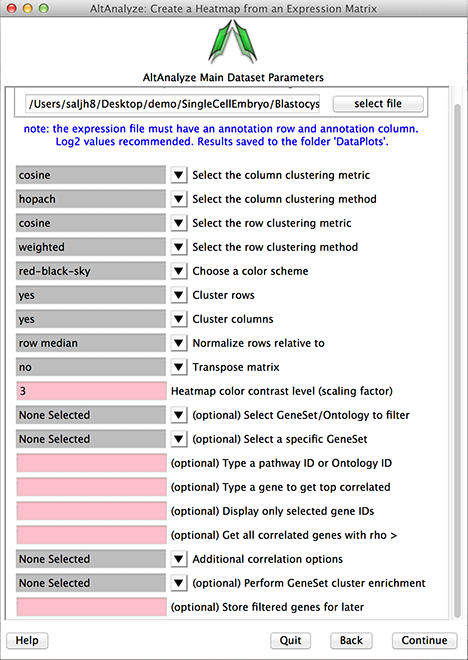
Heatmap interface.
Biological Group Sample Visualization: When sample columns are formatted to include the sample group name (e.g., cancer:sample1 - separated by a colon), these group assignments will be colored in the top color bar. When groups are not present in the sample names, the colors of distinct empirically derived clusters will be show instead.
Clustering Metric: This indicates the distance similarity metric used for clustering. These include a large number of algorithms available in the scipy statistical library.
Clustering Method: This indicates the methods for displaying the distance between elements of each cluster for linkage. In addition, the option hopach will automatically call the R environment, when present, install the hopach library locally within the AltAnalyze directory and call this function automatically.
Choose a color scheme: A number of standard coloring options are provided for visualization (e.g., red-black-green).
Clustering rows or columns: Clustering of rows or columns can optionally be disabled, in which case the imported order will be displayed of rows or columns.
Normalize rows relative to: If imported data is not normalized, it can be normalized relative to the mean of all samples or median. If the data is not log2 transformed, AltAnalyze will determine this and log transform
Transpose matrix: This option will transpose the columns and rows.
Heatmap color contrast level: This option allows the user to adjust the intensity of the displayed plot.
Select Gene Set/Ontology to filter: When loading a file containing IDs indicated in the Main Menu (Other IDs, platform specific or found in the AltAnalyze ExpressionOutput/Clustering folder), AltAnalyze can filter your list based on a large library of pathways, genesets and ontologies supported by GO-Elite. This can included signatures you store in the last option in this menu or from PCA (StoredGeneSets). Hence, users can obtain pathway-specific cluster sets.
Select a specific Gene Set: Select a specific GeneSet or ontology term for the selected GO-Elite class indicated above. Displayed genes are hyperlinked to additional annotations on the web.
Type a pathway ID or Ontology ID: Alternatively enter pathway or ontology ID for quicker selection.
Type a gene to get top correlated: Retrieve just those genes that are most correlated with a gene or identifier listed in the input expression file. Displayed genes are hyperlinked to additional annotations on the web.
Display only selected gene IDs: Display just those genes entered. Displayed genes are hyperlinked to additional annotations on the web.
Get all correlated genes with rho >: For any entered genes or pathways, get all genes correlated to these with the indicated correlation cutoff (must be a value between -1.0 and 1.0).
Additional correlation option: Advanced options for gene filtering and correlation analysis. Options include:
- Top Correlated Only: Only report correlated genes from the original pathway or genes provided, where they correlate to at least 4 other genes.
- Intra-Correlated Only: Only report correlated genes within the filtered pathway or gene set.
- Positive Correlations Only: Only report positively correlated genes within the filtered pathway or gene set.
- Exclude Cell Cycle Effects: Removes correlated gene clusters with more than one cell cycle gene (used only with Perform Iterative Discovery).
- Perform Iterative Discovery: Performs to rounds of clustering and analysis to identify central genes for each expression cluster (round 1) and then return genes only correlated to these (driver genes, round 2). Driver genes are displayed on the right and are preferentially transcription factors.
Perform GeneSet cluster enrichment: Performs a gene set enrichment analysis (GO-Elite) on gene clusters (best with HOPACH). Displays the GO-Elite results for each cluster on the left. Selection of the terms will bring up gene lists with hyperlinks to external information and a network image of the relationship of genes and gene-sets for that cluster. Selected terms will automatically copy the gene list to your clipboard.
Store filtered genes for later: If you give a name to your analysis, the associated genes will be stored for re-analysis later using the StoredGeneSets option in Select GeneSet/Ontology to filter option.
Note: Many of these same options are provided in the Predict Groups interface as well.
Workflow Analysis
This analysis is the standard workflow for microarrays and RNA-Seq data (see tutorials). In this workflow, differentially expressed or outlier genes (defined based on the user's statistical filtering options) are clustered using default coloring and distance algorithms. In addition to genes, cell-type predictions from the new method LineageProfiler are also clustered using this method (see LineageProfiler description for details). When finished with an analysis, the user will be presented with these plots in the interface and can be also be found in the folder DataPlots. These input data matrices can also be re-clustered with different options following an analysis (Additional Analyses option - see below).
The three default plots for genes are:
- Significant regulated genes (relative to the row mean)
- Significant regulated genes (relative to the comparison group mean)
- Outlier regulated genes (relative to the row mean)
All of these plot the log2 fold changes relative to the row mean or comparison mean. The first of these clusters indicates how all samples compare to other samples, without considering specific user-comparisons (e.g., day 10 versus day 0). The second is for the same genes but with fold changes for each sample to the control group mean for any user-defined comparison (including control samples versus the control mean). The third is for any sample for any non-significant genes with a fold change greater than the user-defined fold threshold (default 2 fold) for a given sample versus the mean of all samples in that row.